
About Me
Hi, I am Christy! My passion lies in bridging the gap between business and technology to drive data-driven strategies that create real impact.With a strong foundation in accounting and financial analysis, I excel (yes, pun intended!) at turning numbers into meaningful information that empowers smarter business decisions. I have built a track record of process improvements and increased efficiencies that reduce risk and provide stakeholders with high quality reporting.Thank you for checking out my portfolio!
Technical Skills

- Excel -- pivot tables, functions, lookups, conditional formatting, charts, Power Query, Power Pivot
- SQL -- queries, aggregations, joins, data pivots, CTEs, window functions, data manipulation
- Power BI -- data transformation, data models, DAX, dashboards
- Tableau -- calculations, visualizations, dashboards
Featured Projects
Excel & Tableau
Analyzed data and created Tableau dashboards to help an animal shelter plan and identify opportunities.


Excel & AI
Created an interactive Excel dashboard to uncover trends and insights in hospital emergency room vists with assistance from AI tools.
SQL
Used intermediate SQL to query and analyze 101,000 rows of hospital patient data to answer various questions.


SQL & Excel
Used advanced SQL queries to analyze employee data and provide recommendations to Human Resources department.
Power BI
Created an interactive dashboard to track sales KPIs and trends for a multinational grocery store chain.


Tableau
Created an interactive dashboard to analyze Airbnb's impact on San Francisco.
Education & Certifications
Master of Science, Business Analytics (MSBA) - University of St. Thomas
Master of Business Administration (MBA) - University of St. Thomas
Bachelor of Science, Accounting - Winona State UniversityData Analytics Accelerator BootcampMaven Analytics - courses completed include:
- Excel Pivot Tables & Charts
- Advanced Excel Dashboard Design
- Statistics for Data Analysis
- MySQL Data Analysis
- Advanced SQL Querying
- Intro to Tableau Desktop
- Power Query, Power Pivot, & DAX
- Microsoft Power BI Desktop
Beyond the Numbers: Discovering Insights in Animal Shelter Data
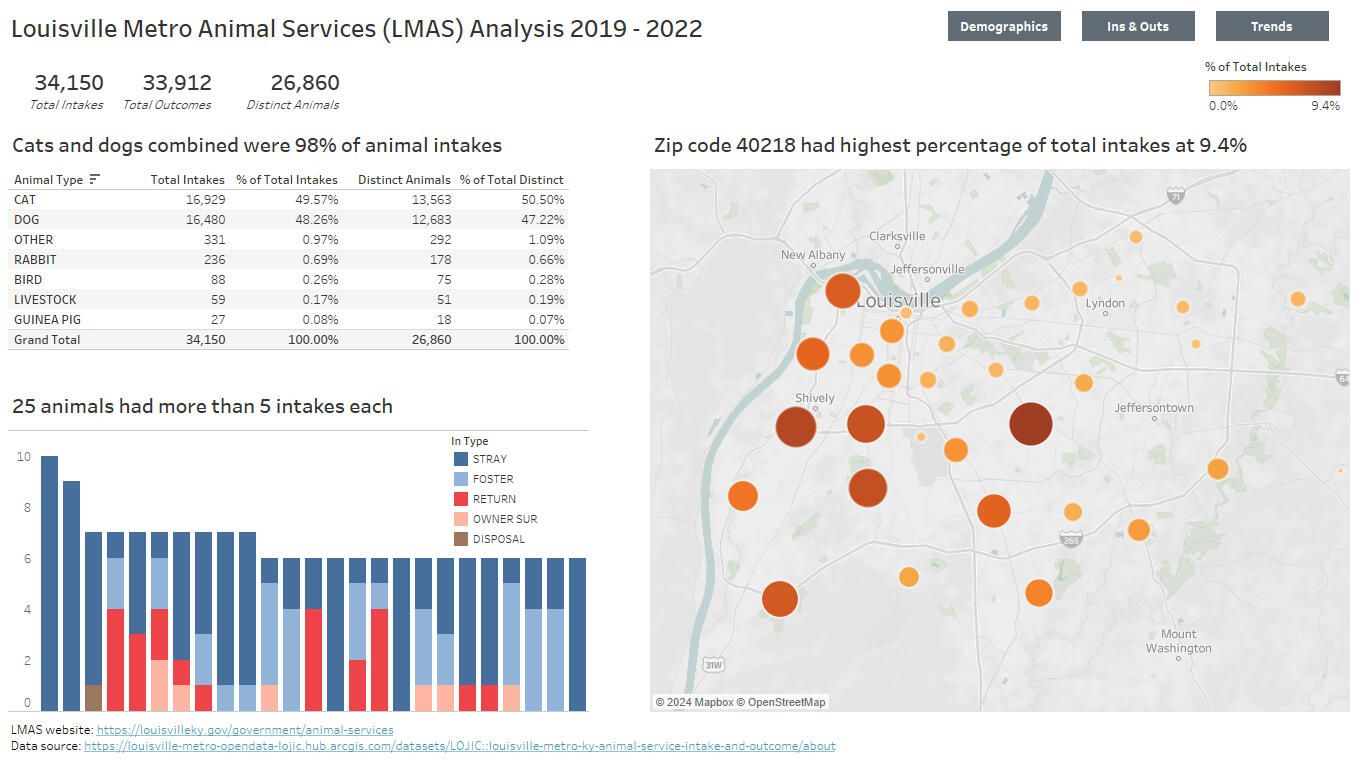
Business Case: Analyze historical data and create dashboards to help the animal shelter plan and use resources as well as identify opportunities to better serve their geographic area.Data Overview: Dataset from Louisville Metro Open Data website with 55,964 rows and 18 columns.Skills: Excel - data cleaning, pivot tables; Tableau - filtering, calculated fields, table calculations, dashboards with bar/column charts, line charts, map, treemap.
Hospital Emergency Room Visit Analysis: From Excel Dashboard to AI Insights
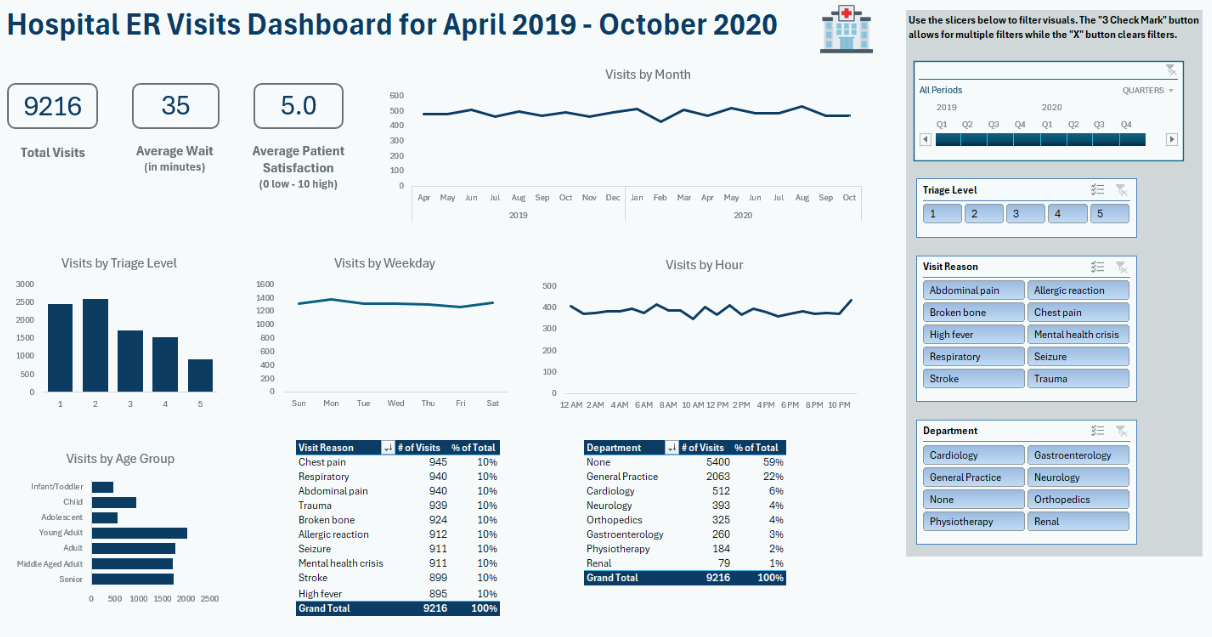
Business Case: Create an interactive exploratory dashboard for the hospital's ER managers to understand trends in visits, using AI tools to generate in-depth analysis and recommendations.Data Overview: Dataset from Real World Fake Data with 9,216 rows and 11 columns.Skills: Excel - pivot tables, pivot charts, and dashboard with timeline, slicers, line charts, and bar charts; Julius AI.
Analysis of Hospital Patient Data Using SQL
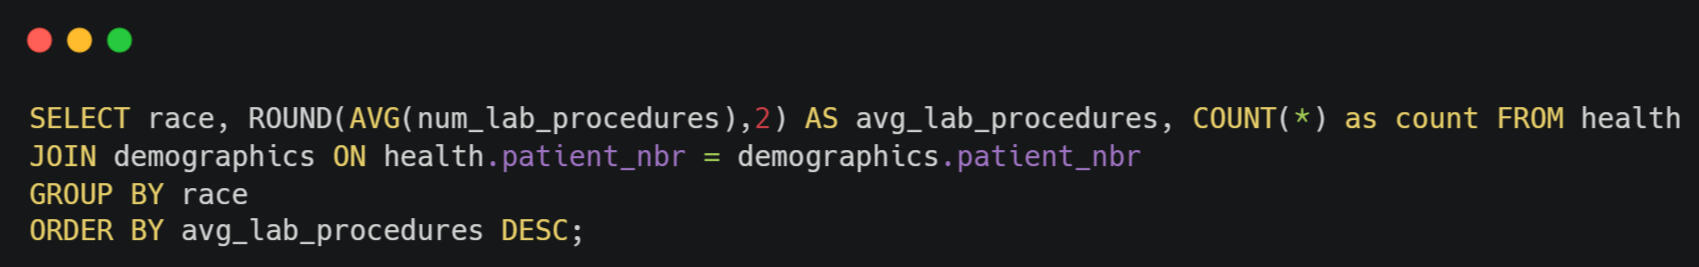
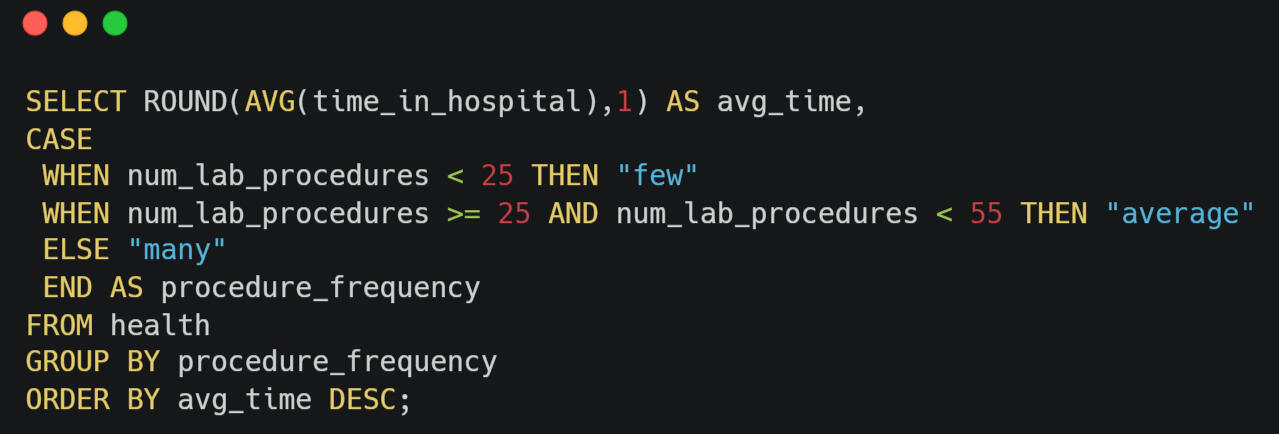

Business Case: Answer various questions from hospital administration including:
(1) Are races being treated differently in terms of number of lab procedures?
(2) What is the relationship between number of lab procedures and time spent in the hospital?
(3) Who are the patients that had an emergency but left the hospital faster than average?Data Overview: Dataset from Kaggle with 101,766 rows and 50 columns.Skills: MySQL queries using intermediate SQL including RPAD, HAVING, JOIN, CASE WHEN, UNION, CTEs, subqueries, CONCAT.
How is Airbnb impacting San Francisco?
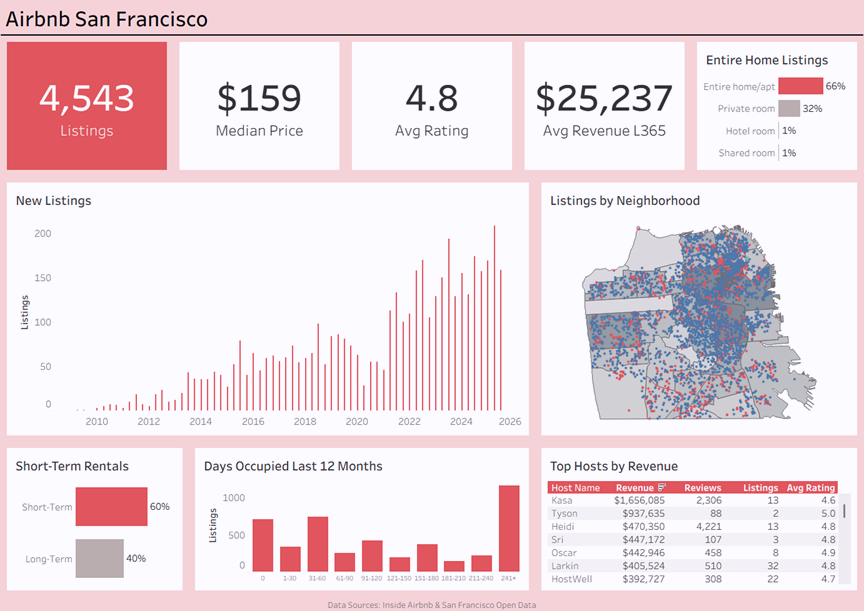
Business Case: Create an interactive dashboard analyzing Airbnb's impact on San Francisco.Data Overview: Dataset from Inside Airbnb with 4,543 rows and 39 columns. GeoJSON file from San Francisco Open Data for neighborhood mapping.Skills: Calculated fields, dashboard with text sheets, bar/column charts, map, table, interactivity.
Maven Market Grocery Store Performance Analysis
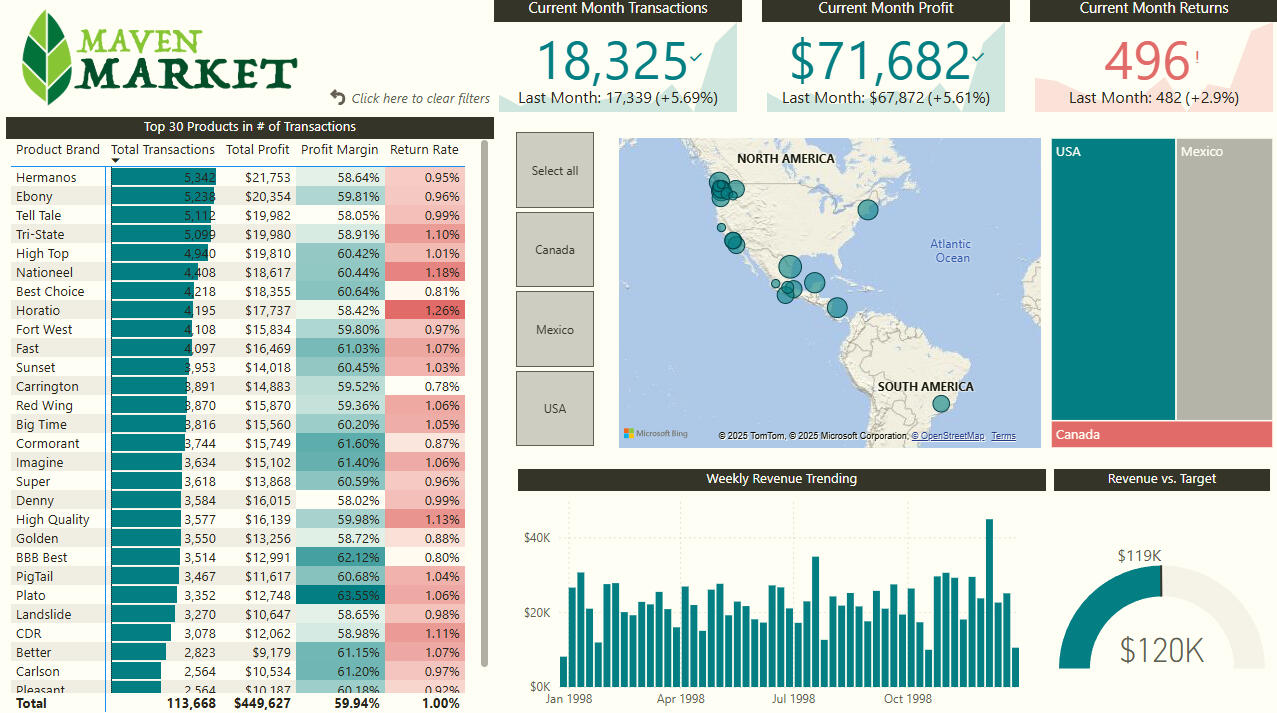
Business Case: Create an interactive dashboard to track sales KPIs and trends for a multinational grocery store chain.Data Overview: 8 csv files of raw data including transactions (2 files), returns, products, customers, stores, regions, and a calendar.Skills: Power Query, data transformation, data modeling, calculated columns, DAX measures, KPI cards, column chart, matrix, gauge, treemap, map.
HR Analytics with SQL: Exploring Employee Data
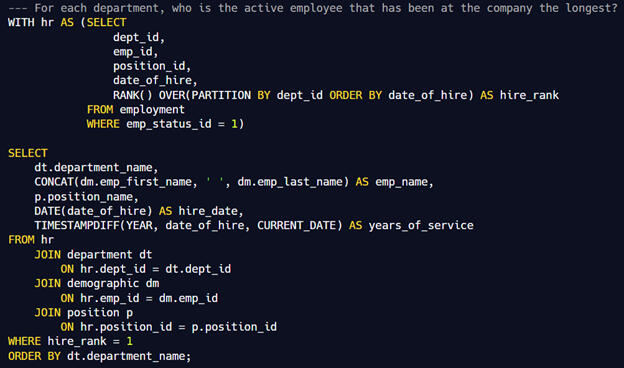
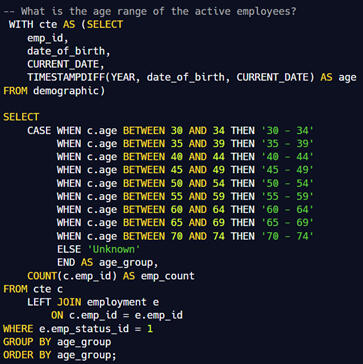
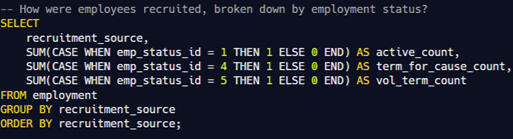
Business Case: Analyze employee data for insights and provide recommendations to Human Resources department.Data Overview: Dataset from Kaggle with 311 rows and 36 columns. Used Power Query to separate into 9 tables.Skills: SQL - multiple joins, CTEs, window functions, CASE WHEN statements, pivoting data, data manipulation; Excel - Power Query, pivot tables, data cleaning, data transformation, data modeling.